Open-source anomaly detection for wildfires.
Today we are releasing an open-source wildfire early-warning system, worldwide. It works by anomaly detection: it takes the raw fire detections that NASA satellites publish every day, learns what normal activity looks like for every five-square-kilometre cell of land, and turns the deviations into a short, ranked list of alerts. The pipeline runs fully automated, end to end, in under an hour a day. The code is MIT-licensed and free to self-host, and it is running now on a public dashboard.
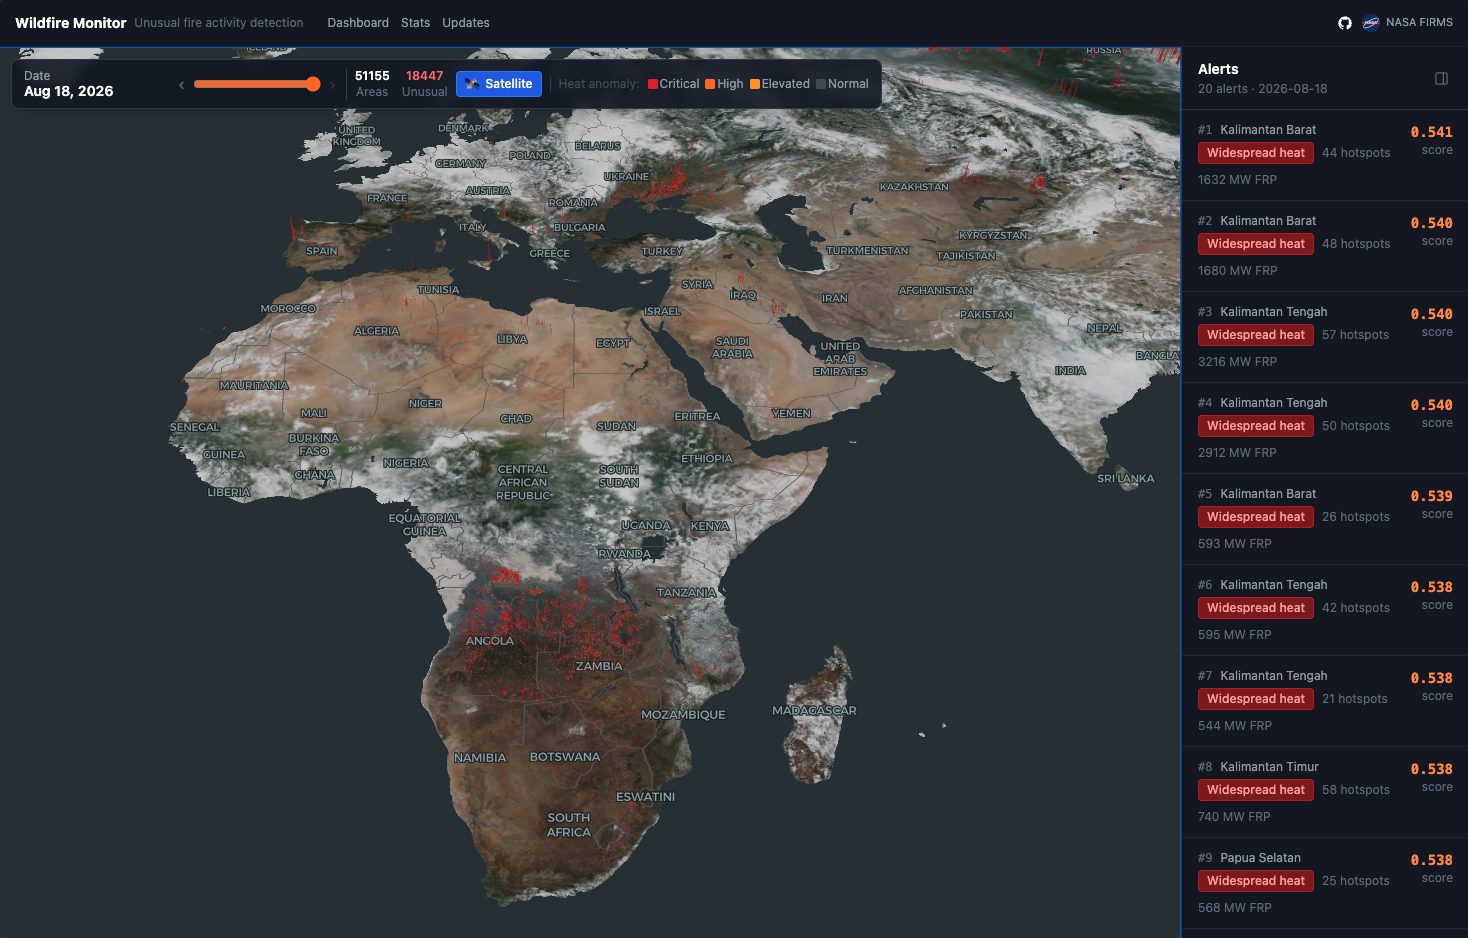
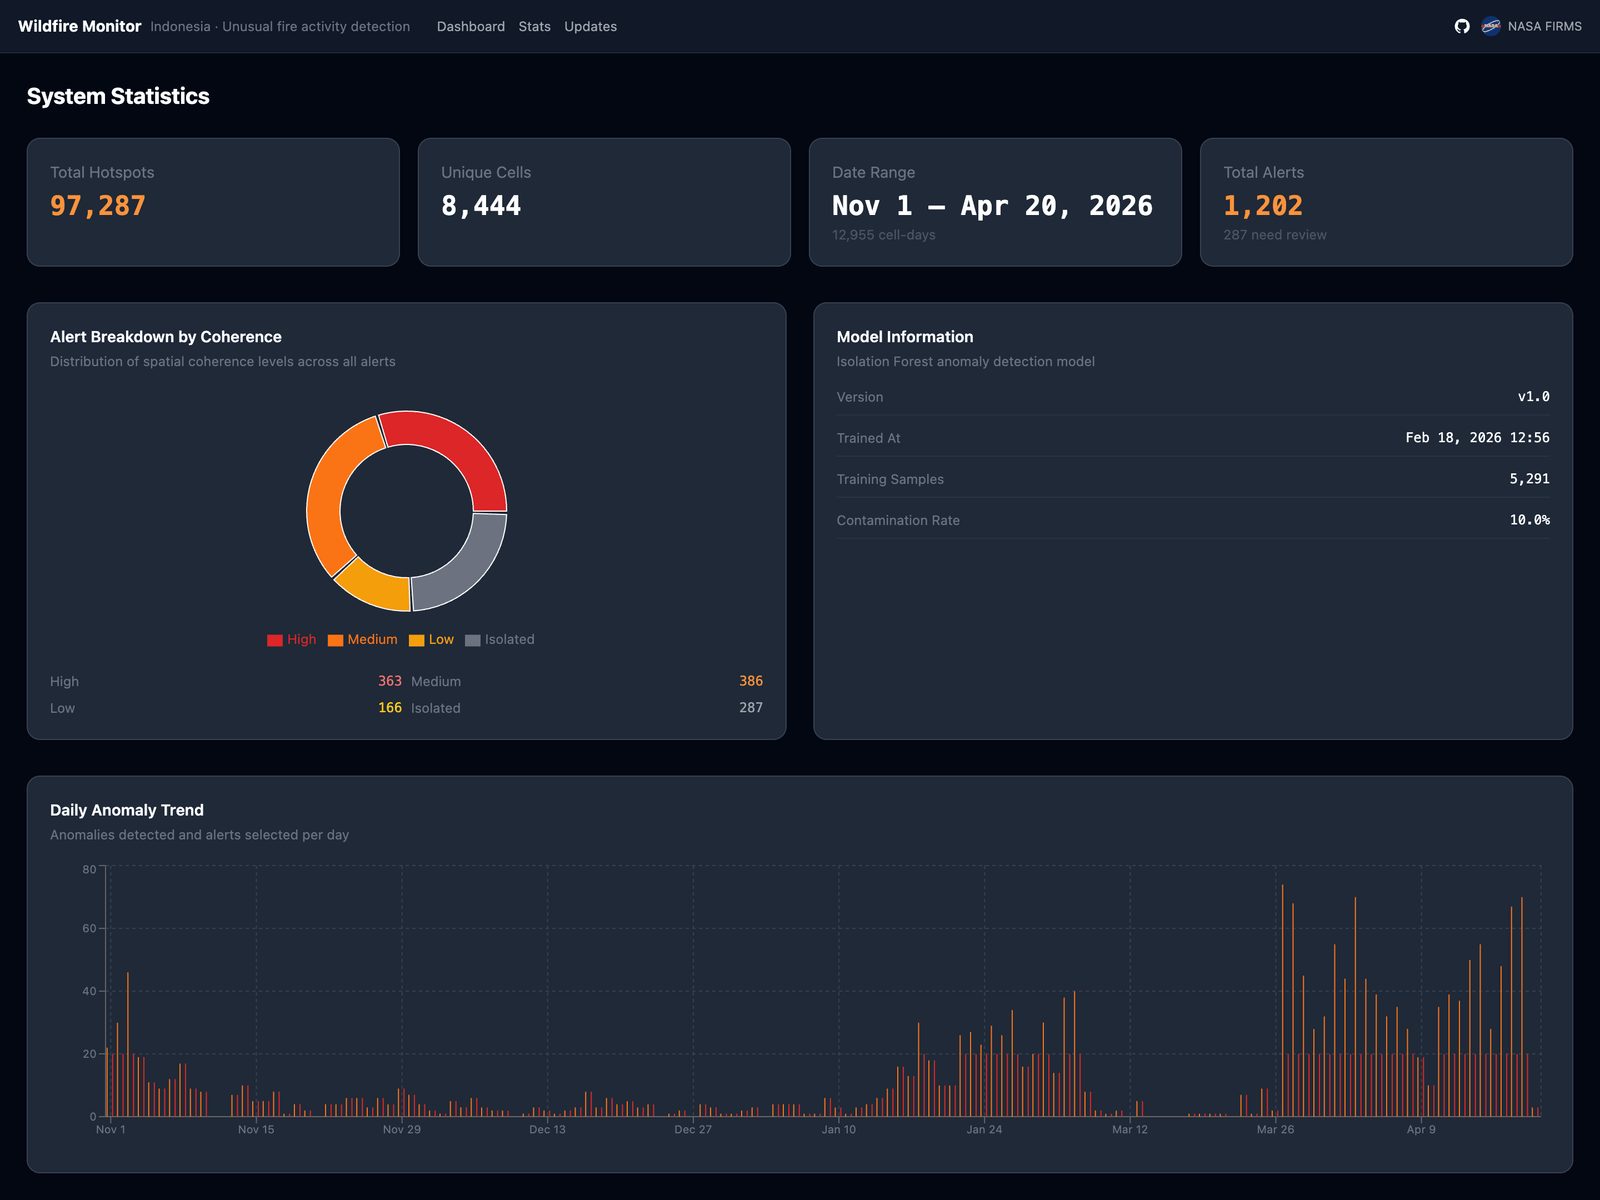
We built it first for Indonesia, where satellites log more than 100,000 fire hotspots in a year. We are releasing it worldwide because the problem has stopped being regional. By 5 August, fires had burnt 505,683 hectares in the EU this season, according to the EU's Joint Research Centre: a third more than at the same point last year, and last year was the worst on record. On 18 August the system tracked 51,155 areas with fire activity worldwide and flagged 18,447 of them as unusual.
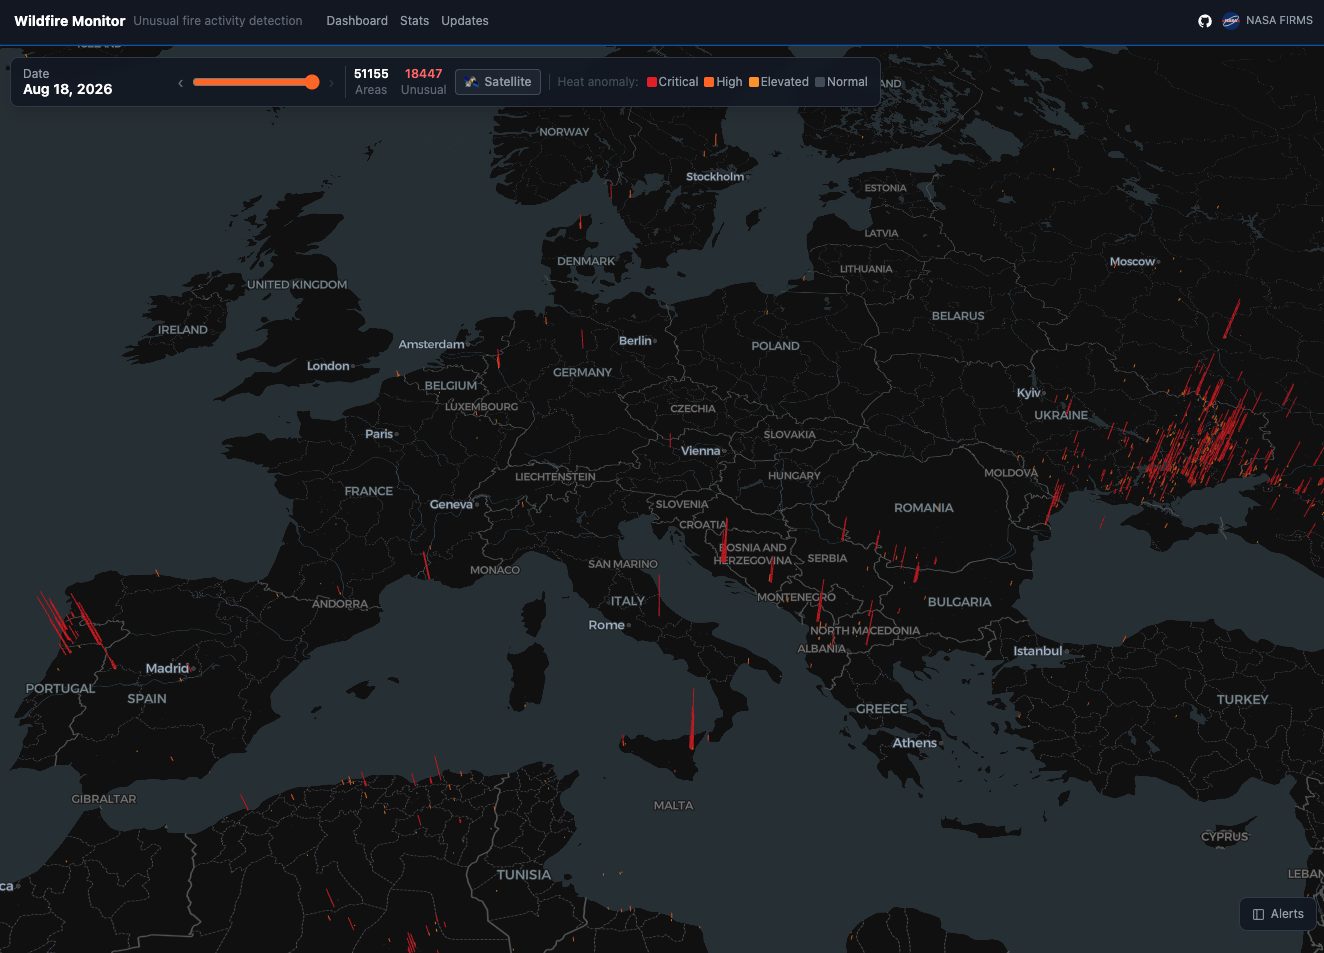
The hard part was never detecting fire. Satellites do that, and NASA FIRMS publishes the detections for the whole globe, free, twice a day. The hard part is context. A single hotspot can be a farmer clearing a field, an industrial flare, or the first hour of a disaster, and a fixed threshold that works in one region fails in the next. The question that matters is not whether something is burning. It is whether this fire is unusual for this place, at this time of year.
So the system learns baselines instead of taking thresholds. Detections are mapped onto a hexagonal grid, roughly five square kilometres per cell, and an Isolation Forest model scores every cell every day on six signals: how many hotspots, how much radiative power, how sharply activity changed against yesterday and against the seven-day average, and what the six neighbouring cells are doing. Nothing is hand-tuned. The model calibrates itself to each area's own history.
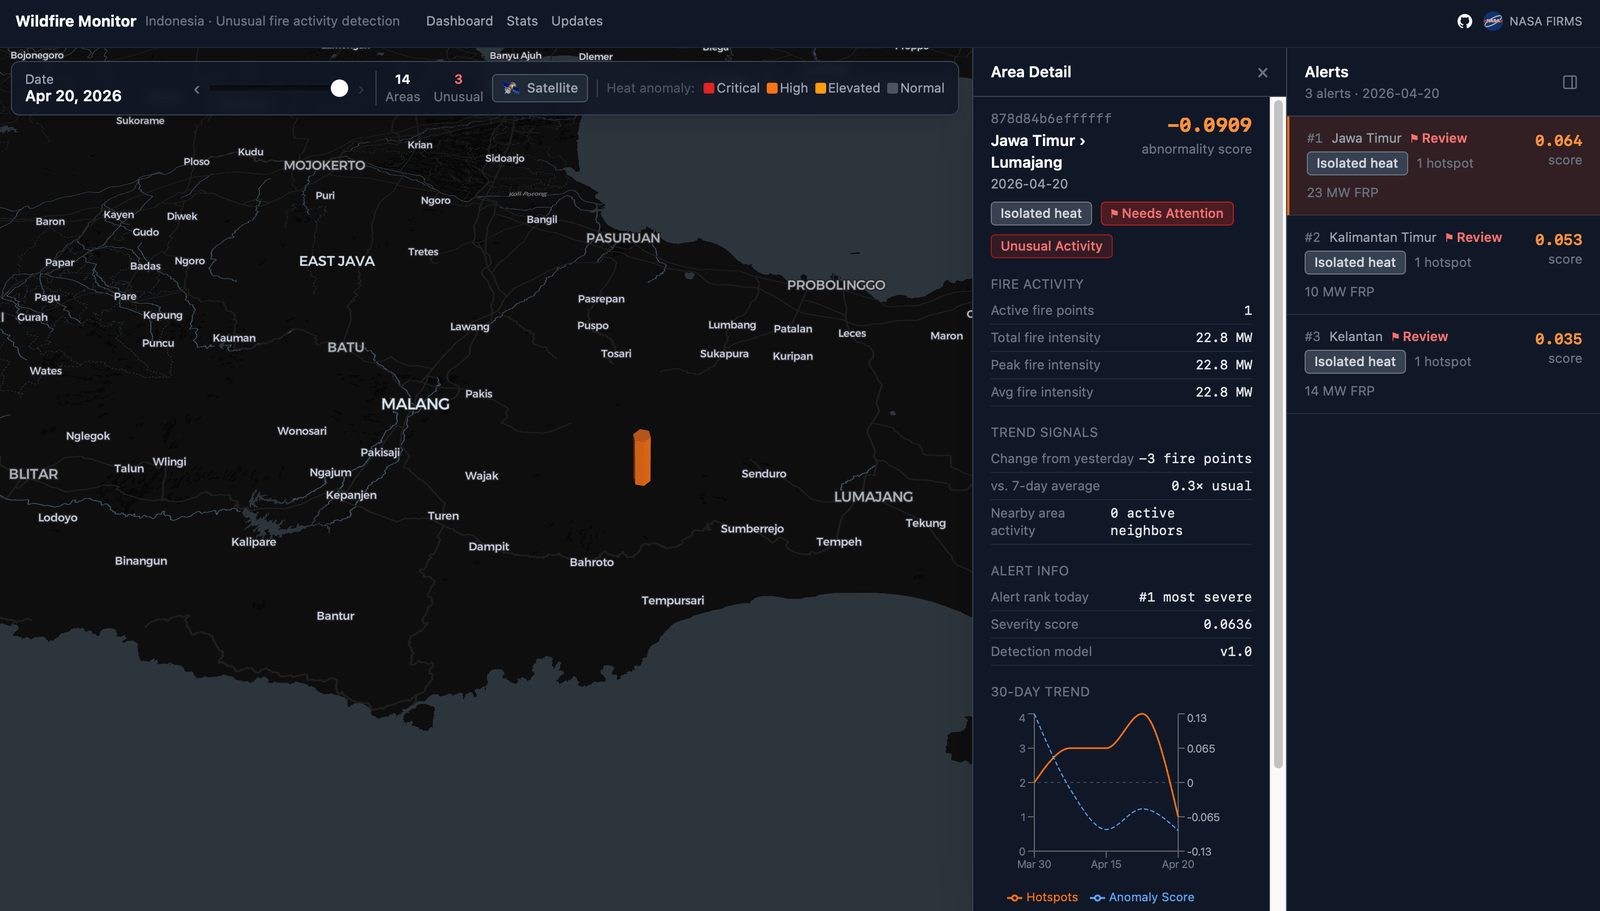
The detail we care most about sits after the model. A statistical anomaly is not yet an alert. Every flag is cross-checked against an independent signal, spatial coherence: whether the fire is spreading across neighbouring cells or standing alone. The final ranking weighs the model at 70 percent and the context at 30. And an anomaly with no active neighbours is not pushed out as urgent. It is routed to a person for review. A model that proposes, a second signal that validates, a person at the gate, and a ranked record of every call: it is the same shape we install inside companies, applied to public data.
That is also why it is free. NASA's data is public and the code is open, and together they make a working reference of what defensible AI engineering looks like: defined inputs, a model choice you can explain to a sceptic, validation built into the architecture, and output somebody can act on. The pattern carries well beyond fire, to floods, crop stress, and deforestation. Fork it, point it at your geography, and build on it.